
How does a music visualizer work? FFT, beat detection and shaders
A good visualizer looks like it understands the music: the floor jumps on the kick, sparks fly on the hi-hats, the colours swell when the chorus comes in. There is no magic behind it. Every visualizer does the same two jobs, many times a second: it measures the sound, then it draws a picture from those measurements. Here is how each part works.
1. From sound wave to spectrum
Digital audio is a stream of samples, usually 44,100 or 48,000 per second, each one the position of the speaker cone at that instant. That raw waveform tells you how loud the sound is, but not what is in it. To see the bass and the cymbals separately, a visualizer takes a short slice of samples (often 1,024 or 2,048) and runs a Fast Fourier Transform (FFT) on it.
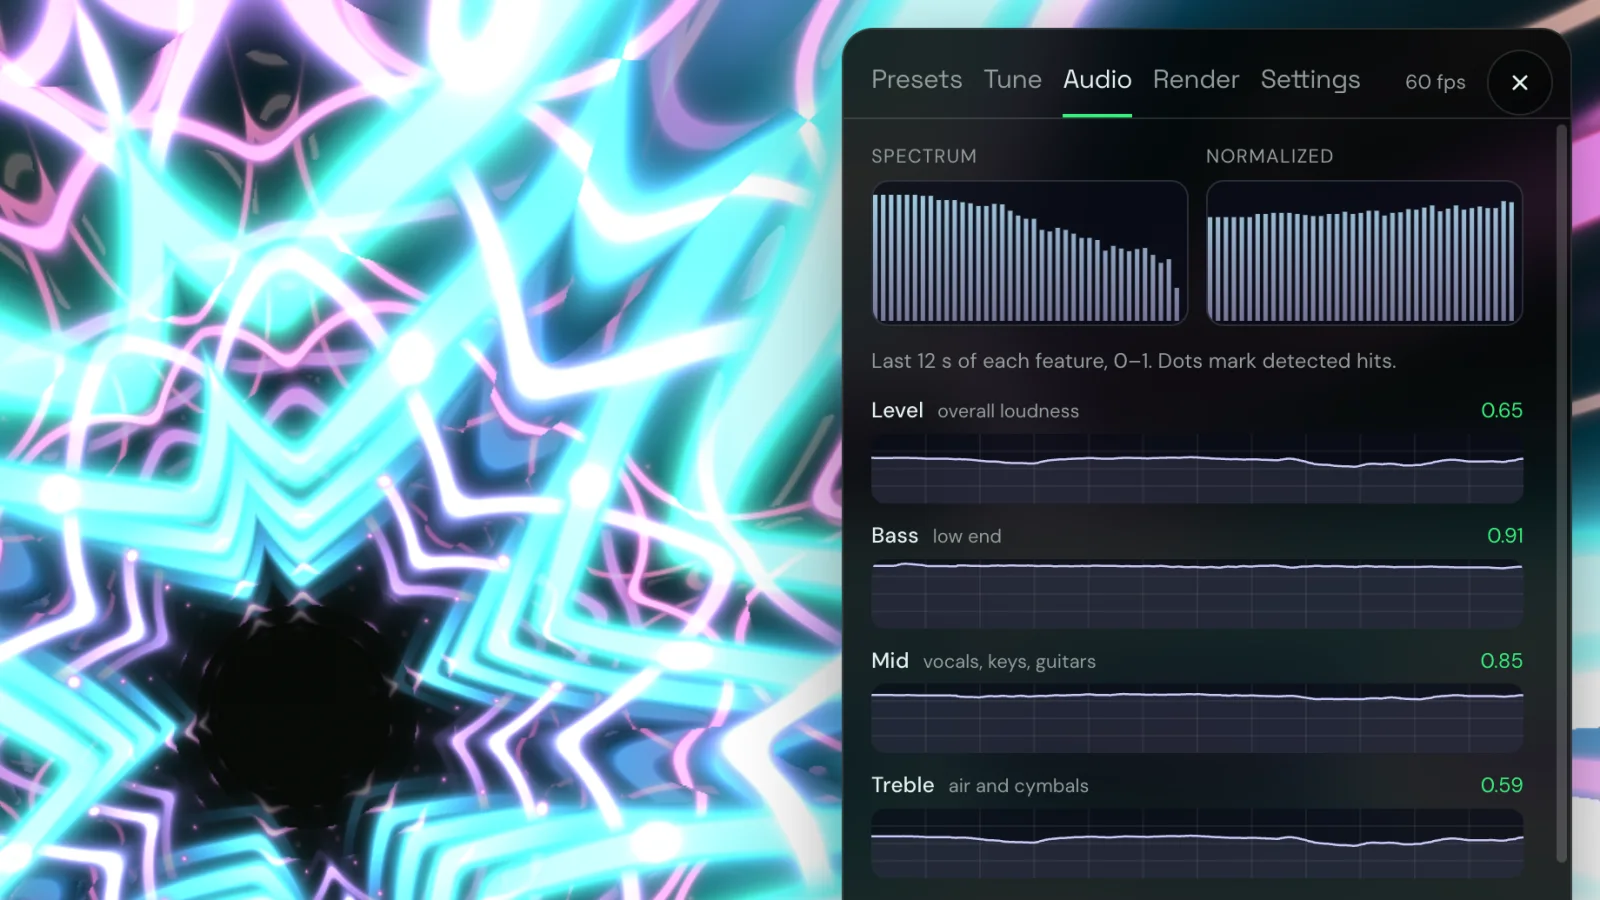
The FFT splits the slice into frequency bins and says how much energy each one holds. That is the spectrum: the familiar row of bars, low notes on the left, high on the right. In a browser, the Web Audio API's AnalyserNode does this for you.
The bins are evenly spaced in hertz, but hearing is not: one octave of bass covers a few bins, while one octave of treble covers hundreds. So visualizers regroup the bins on a logarithmic scale, and many also normalize the spectrum so quiet and loud recordings both fill the screen.
2. Bass, mids and treble
Most presets don't need a thousand numbers. They need a few: how loud is the low end, the middle, the top. Summing the spectrum into bands gives exactly that. Rough boundaries are around 20–250 Hz for bass, up to a few kilohertz for mids, and above that for treble, but every visualizer draws the lines a little differently.
In Deus these are Bass (low end), Mid (vocals, keys, guitars) and Treble (air and cymbals), next to an overall Level. A tunnel might move faster with bass, while treble adds sparkle.
3. Smoothing: why bars don't flicker
Raw FFT values jump around from frame to frame. Drawn directly, they flicker. So visualizers smooth them, usually by blending each new value with the previous one. Many use different speeds for rising and falling: rise fast so a hit feels instant, fall slowly so the picture doesn't twitch. The amount of smoothing is a trade-off between calm motion and tight timing.
4. Onsets and beats: kicks, snares and hi-hats
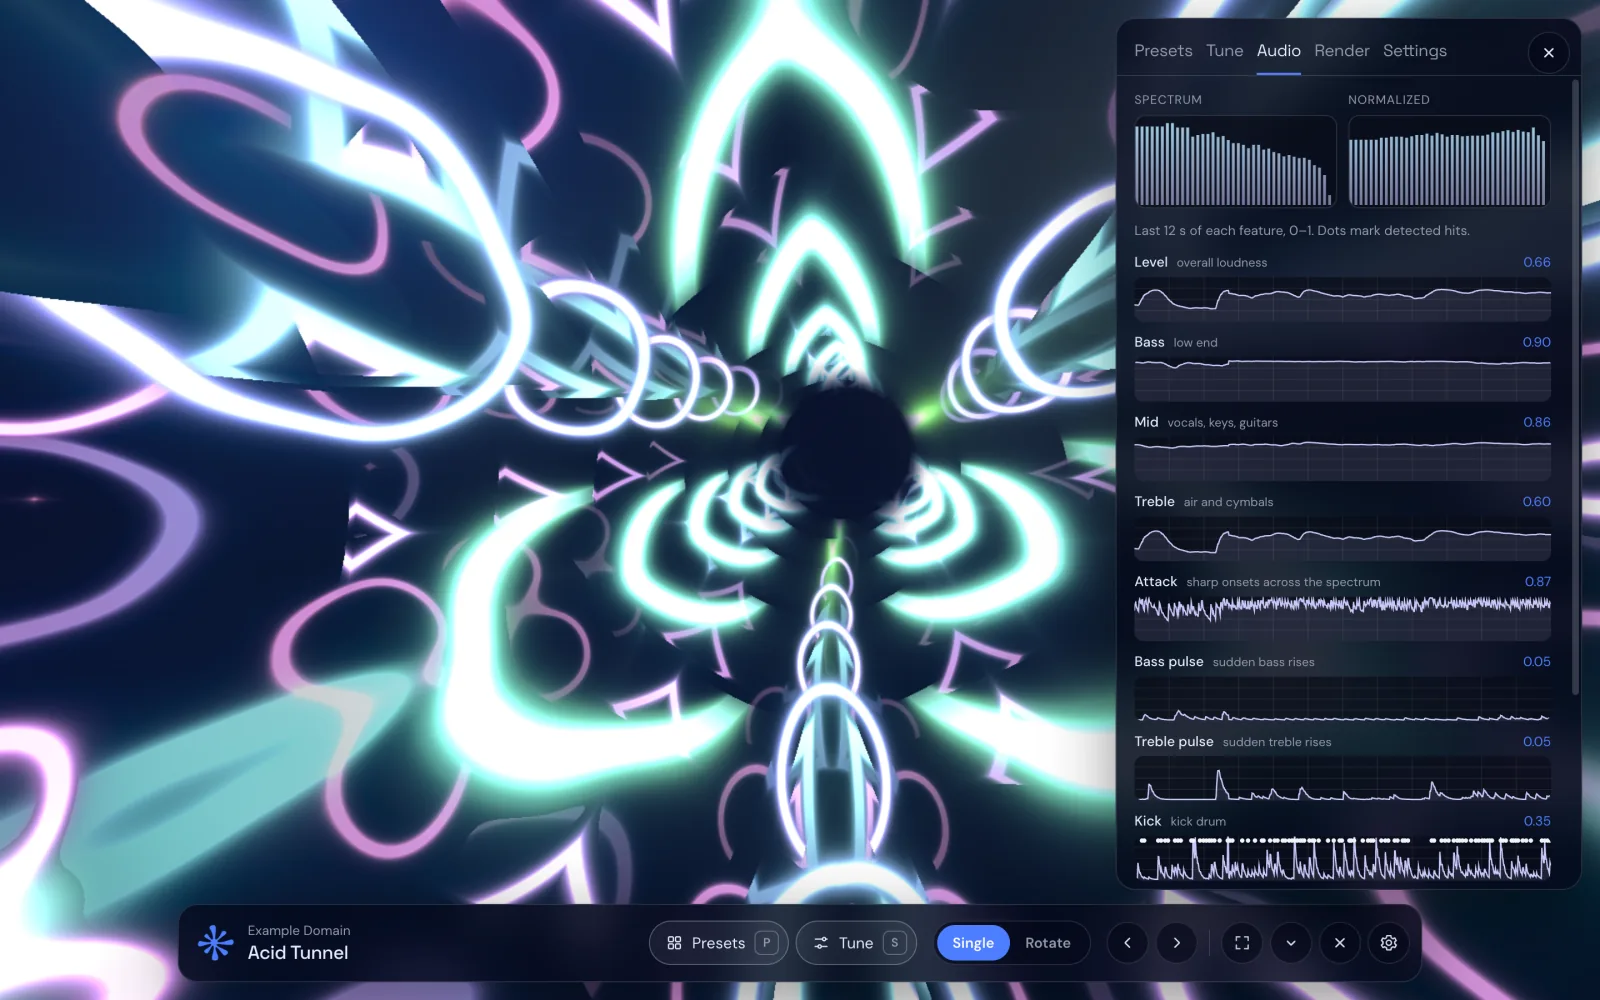
Smoothing blurs exactly the thing people notice most: the hits. So hits are measured separately. The usual tool is onset detection: watch how fast energy is rising, compare it to the recent average, and fire when it jumps above a threshold. Watching the low band catches kicks, the mid and noisy bands catch snares and claps, and the very top catches hi-hats and shakers.
Deus exposes this as several features: Attack (sharp onsets across the spectrum), Bass pulse and Treble pulse (sudden rises), and separate Kick, Snare and Hi-hat detection. Energy tracks how busy the last few seconds were, so a preset can build up through a drop and relax in a breakdown.
5. Notes
Some visuals follow harmony, not rhythm. Folding the spectrum into the 12 pitch classes (C, C♯, D and so on, ignoring the octave) gives a chroma vector: which notes are sounding right now. Deus calls these Notes and uses them for note-reactive presets.
6. Drawing: shaders on the graphics card
The measurements are only a handful of numbers per frame. The picture is where the work is. Modern visualizers draw with shaders: small programs that run on the GPU, often once for every pixel on screen, in parallel. The audio features arrive as inputs (called uniforms), and the shader turns them into colour: a tunnel's speed, a fractal's zoom, the brightness of a flash.
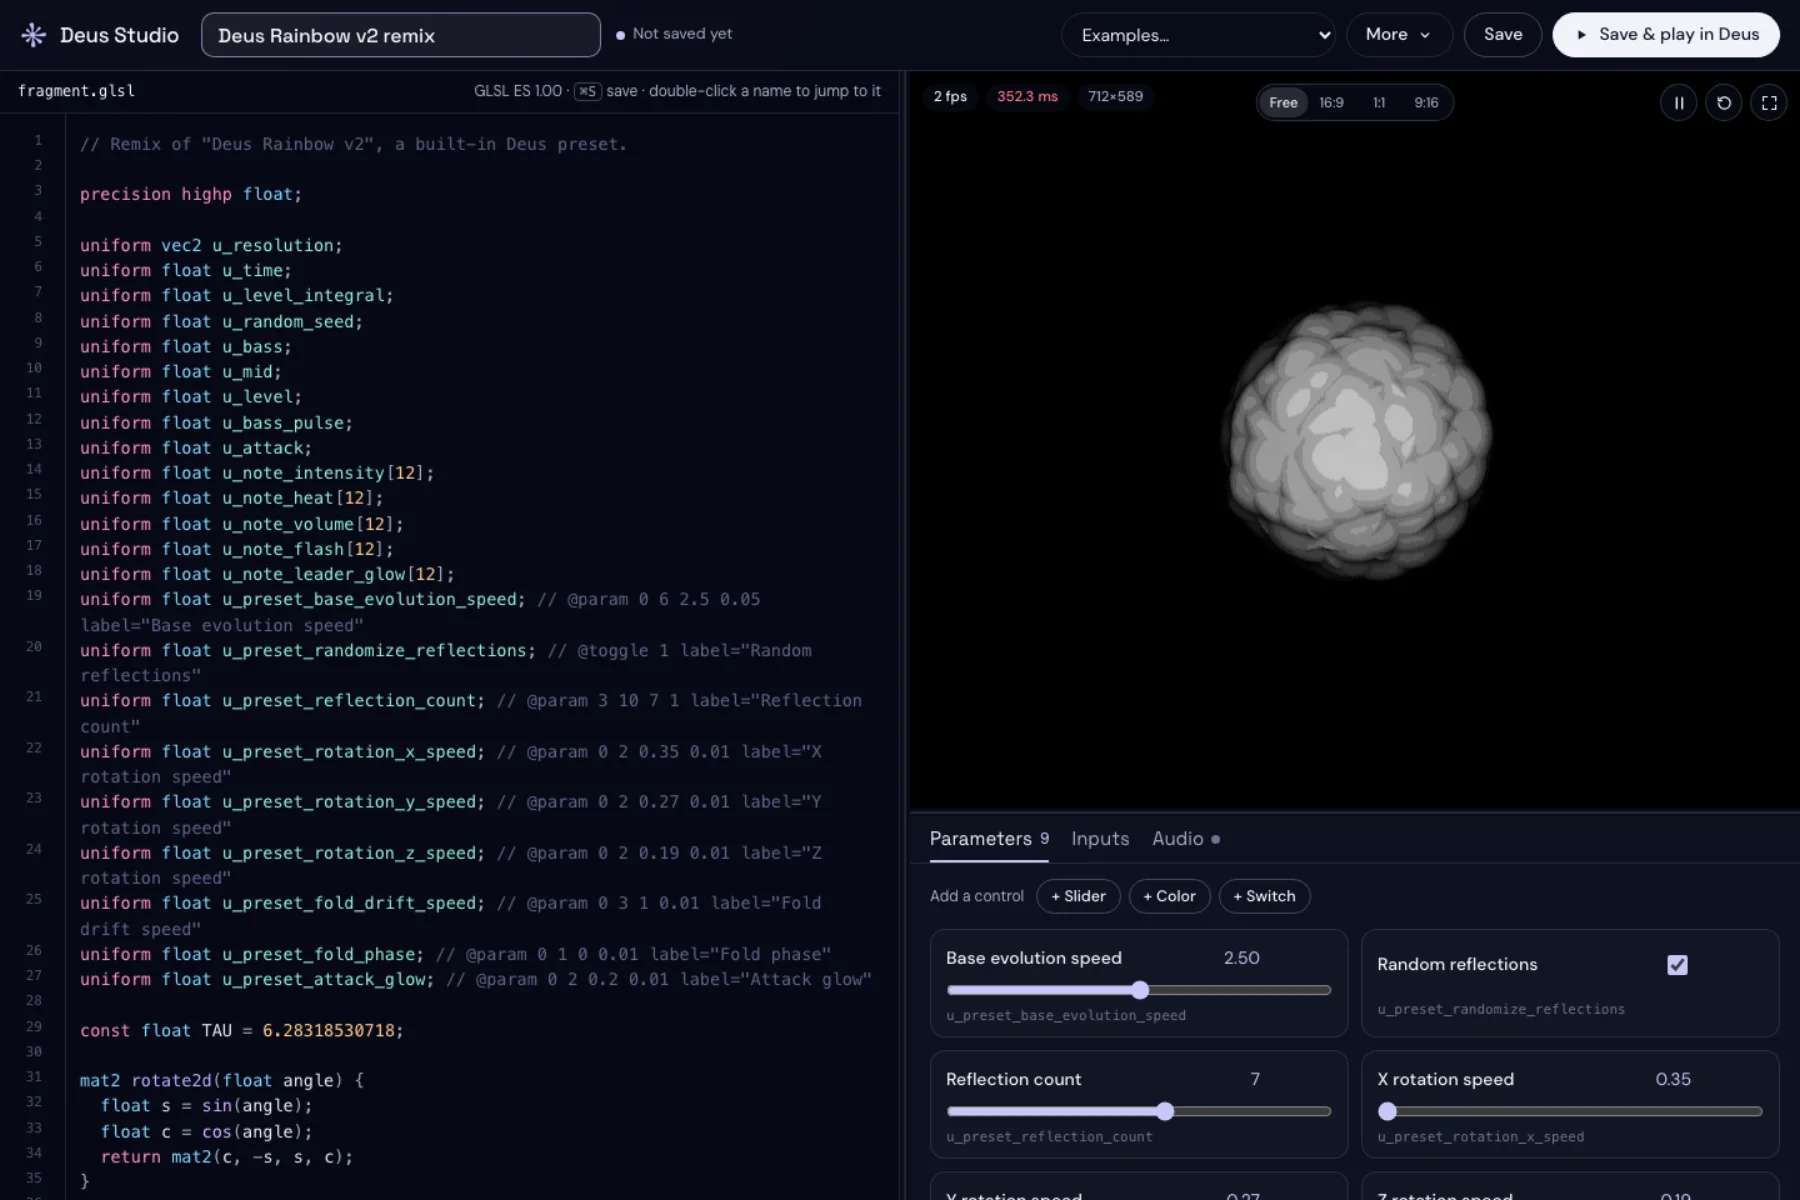
Deus draws its own scenes as WebGL shaders. In Deus Studio you can write one yourself in GLSL, with live frequency arrays, level, bass, mids, treble, pulses, drum hits and note intensity as inputs, and Shadertoy-style mainImage and iTime.
7. Feedback: the MilkDrop trick
MilkDrop, the Winamp-era visualizer, made a simple idea famous. Every frame starts from the previous frame, slightly zoomed, rotated and warped, and new waves are drawn on top. Because each image feeds the next, small motions add up to trails, tunnels and liquid patterns. Beats and loudness steer the zoom and colour. Deus plays classic MilkDrop presets in the browser, each with its authors' credit.
8. No analysis at all: the XY oscilloscope
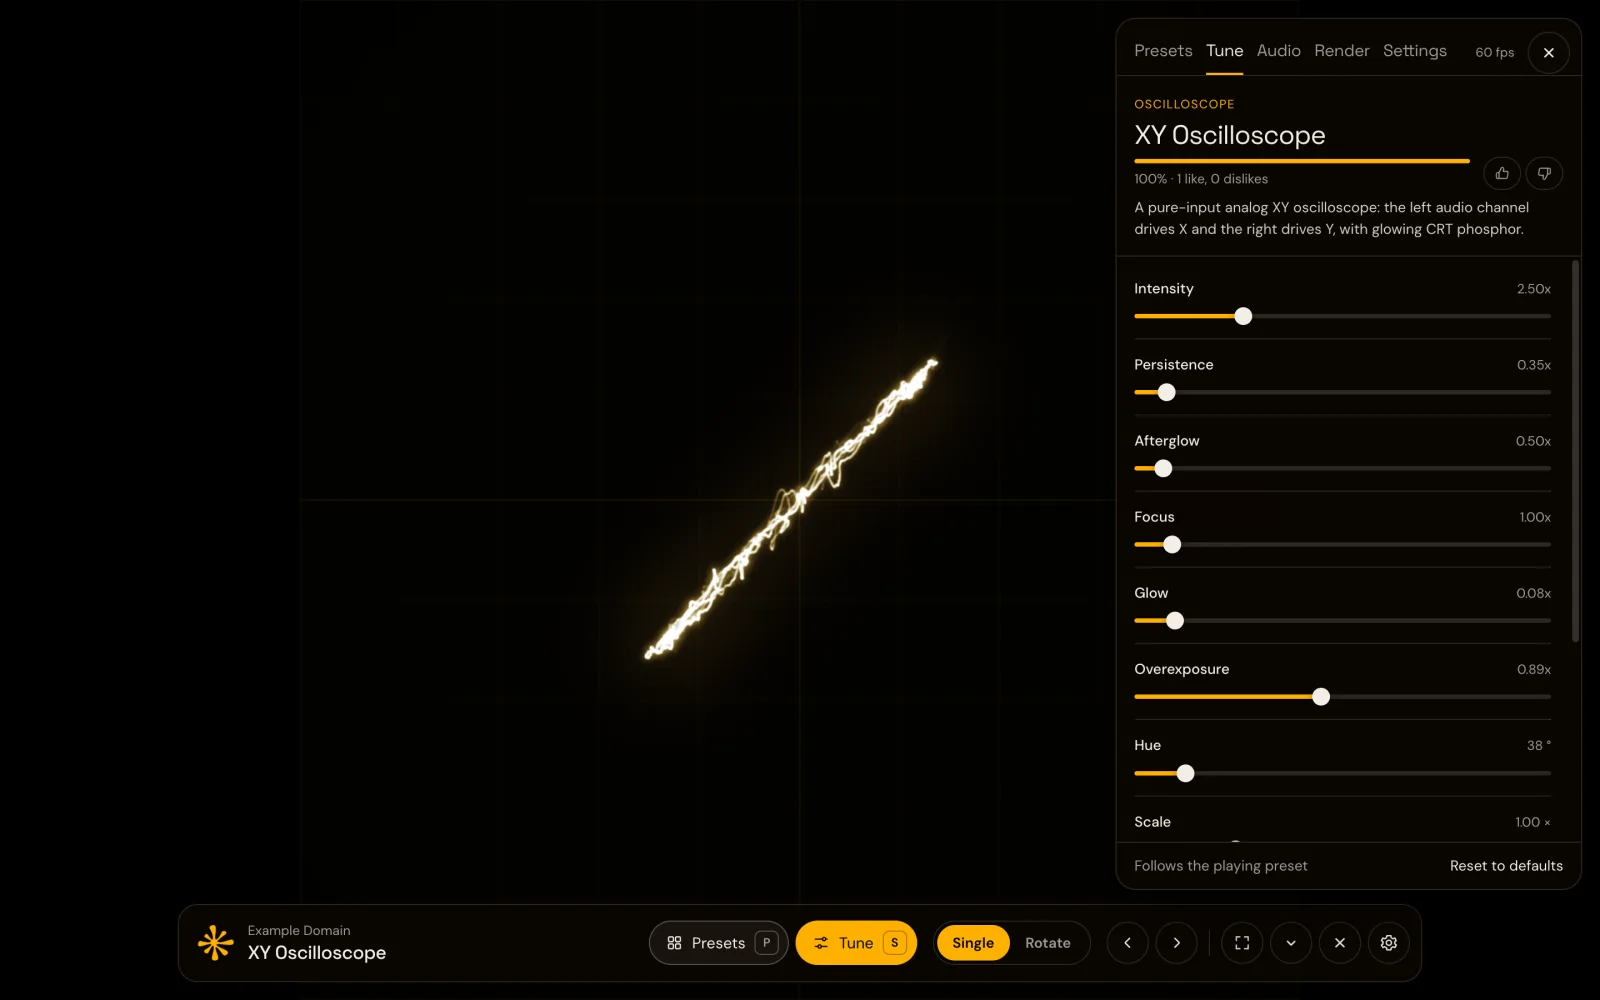
The oscilloscope skips the spectrum entirely. It draws the raw stereo waveform, every sample: the left channel moves the beam sideways, the right one up and down. Mono sound draws a diagonal line, wide stereo draws shapes, and music made for it draws pictures. More in oscilloscope music.
Why some songs look better than others
Visualizers react to what is measurable. Music with clear drums and a strong low end gives clean kicks and big bass swings. Ambient music, solo piano or speech has few sharp onsets, so the picture moves more slowly. Heavily compressed masters can keep every band near the top, which leaves less contrast to show.
Try it on your own music
In Deus every preset, whether WebGL, Canvas 2D, MilkDrop or Oscilloscope, listens to the same analysis, run locally in your browser on the tab you choose. Nothing is recorded or uploaded. Start with visualizing any tab, or turn it into a video.